Data to Chart: Enhance Visuals with Graphs
Estimated reading time: 12 minutes
Source
You can get the GitHub Source Files here.
Overview
The User Interface of Migrated Legacy Applications runs on Web Browser technology. The language description is HTML, an open standard. There are thousands of third party libraries designed to run on HTML. Business Applications can benefit from one specific kind of library, one that takes a series of data points to produce Charts.
One page in SunFarm Application that could benefit of a Chart to display its data, is the Customer Sales/Returns Page.
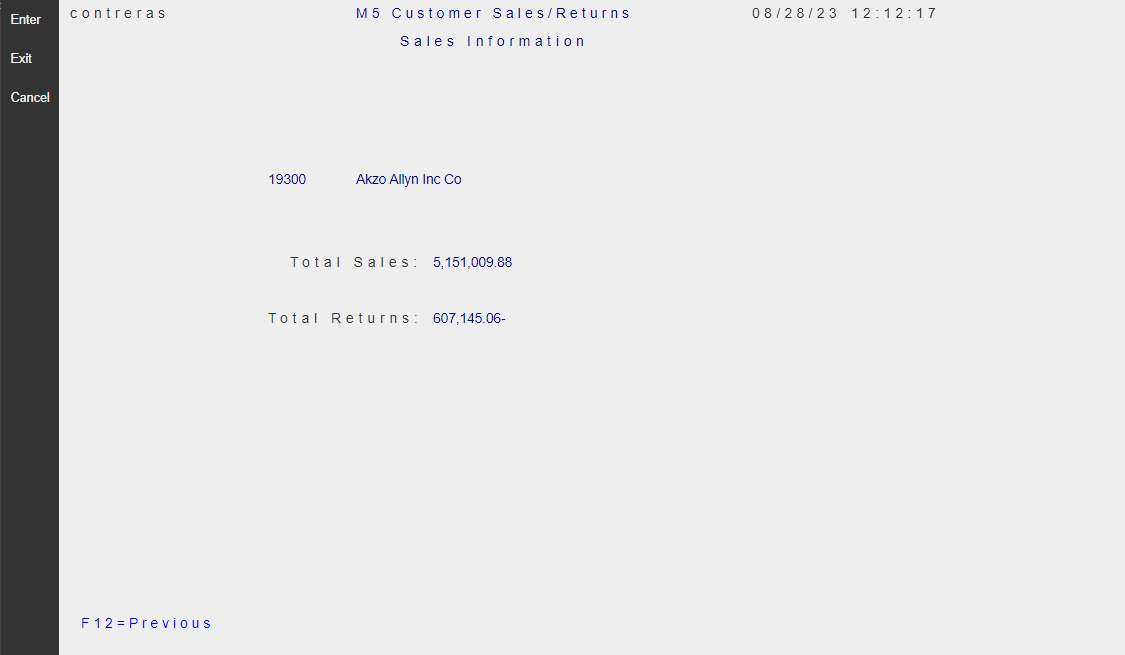
Replacing numeric Data points with a Chart
A simple Bar Chart replaces the the Total Sales and Total Returns values.
The Chart is rendered by amcharts library. Its useful features include:
- It offers a very simple API.
- It grants a free license, by imbedding a link to their website, prohibiting removing or covering such link. This is very suitable for an example.
- Produces high-quality SVG graphics.
The basic steps to add a amchart are:
a) Add a named <div> with a style that includes width and height attributes.
b) Using JavaScript, instantiate the chart given the id property and the type of chart to be created.
c) Using the new chart object, push axis, data series and any other chart objects describing the chart and/or the data in the series.
The ~\SunFarmSite\Areas\SunFarmViews\Pages\CUSTDSPF.cshtml Razor Page, defines several Displayfile records, among them, one for the SALESREC Model record. The migration uses the following fields defined in that record, namely: SALESREC.SCPGM, SALESREC.SFCUSTNO, SALESREC.SFNAME, SALESREC.SFSALES and SALESREC.SFRETURNS.
The fields that have the Total Sales and Total Returns values are SALESREC.SFSALES and SALESREC.SFRETURNS. These will be used to Chart instead of just displaying its values (as the Legacy Application does).
The following is the modified DdsRecord. Rows 1 to 5 show standard output (very similar to the migration). At the bottom of the Display Record, we have added two <div> s : a container and the chart itself.
Note how the <div> for the chart has the id set to sales-chart. That name will be passed as a parameter for the instantiation of the Chart object (see scripting below)
<DdsRecord For="SALESREC" StretchConstantText=false KeyNames="F12 'Cancel';">
    <span class="page-title">SunFarm Customer Sales/Returns</span>

    <div Row="1">
        <DdsConstant Col="2" Text=@System.Environment.UserName />
    </div>
    <div Row="2">
        <DdsCharField Col="2" For="SALESREC.SCPGM" />
    </div>
    <div Row="3">
        <DdsConstant Col="2" Text="Customer Number" />
        <DdsDecField Col="15" For="SALESREC.SFCUSTNO" Color="DarkBlue" EditCode="Z" Comment="CUSTOMER NUMBER" />
    </div>
    <div Row="4">
        <DdsConstant Col="2" Text="Customer Name" />
        <DdsCharField Col="15" For="SALESREC.SFNAME" Color="DarkBlue" />
    </div>
    <div Row="5"> </div>

    <div id="sales-chart-container">
        <div id="sales-chart">Sales Chart</div>
    </div>
The following CSS centers the container and gives the chart dimensions:
#sales-chart-container div {
    margin: 0 auto;
    width: 50%;
    height: 20rem;
}

#sales-chart {
    background-color: whitesmoke;
    border-style: solid;
    border-color: lightgrey;
    border-width: medium;
}
Scripting to use third-party Charting Library
At the bottom of the The ~\SunFarmSite\Areas\SunFarmViews\Pages\CUSTDSPF.cshtml Razor Page, we write three small script blocks:
- A reference to the third-party
core.jslibrary file, given its source URL. - A reference to third-party
charts.jslibrary file, given its source URL. -
Our explicit use of the library:
a) Only if the
divwith theid='sales-chart'exists (as a rendered object) do we instantiate the chart object. (The existence of the object withid='sales-chart'determines when theSALESRECrecord is active).b) We instance the chart (naming the
idwhere the graph should be drawn), and define the data-series with two values we want plotted:@Model.SALESREC.SFSALESand@Model.SALESREC.SFRETURNS.
Note: The details of how to use
amchartslibrary is outside the scope of this example. Please read Here for more information.
<script src="https://cdn.amcharts.com/lib/4/core.js"></script>
<script src="https://cdn.amcharts.com/lib/4/charts.js"></script>
<script>
    const CHART_ID = 'sales-chart';
    const chartEl = document.getElementById('sales-chart');
    if (chartEl) {
        const chart = am4core.create(CHART_ID, am4charts.XYChart);
        const xAxis = chart.xAxes.push(new am4charts.CategoryAxis());
        const yAxis = chart.yAxes.push(new am4charts.ValueAxis());

        xAxis.dataFields.category = 'category';

        const series = chart.series.push(new am4charts.ColumnSeries())
        series.dataFields.valueY = 'amount';
        series.dataFields.categoryX = 'category';
        series.columns.template.tooltipText = "{categoryX}: [bold]{valueY}[/]";

        series.columns.template.adapter.add("fill", (fill, target) => {
            if (target.dataItem.index == 0) {
                return 'blue';
            }
            return 'red';
        });

        chart.data = [
            {
                category: 'Total Sales',
                amount: @Model.SALESREC.SFSALES
            },
            {
                category: 'Total Returns',
                amount: @Model.SALESREC.SFRETURNS
            }
        ];
   }
</script>
Results
| Legacy Display Values | Using Third Party Chart |
|---|---|
 |
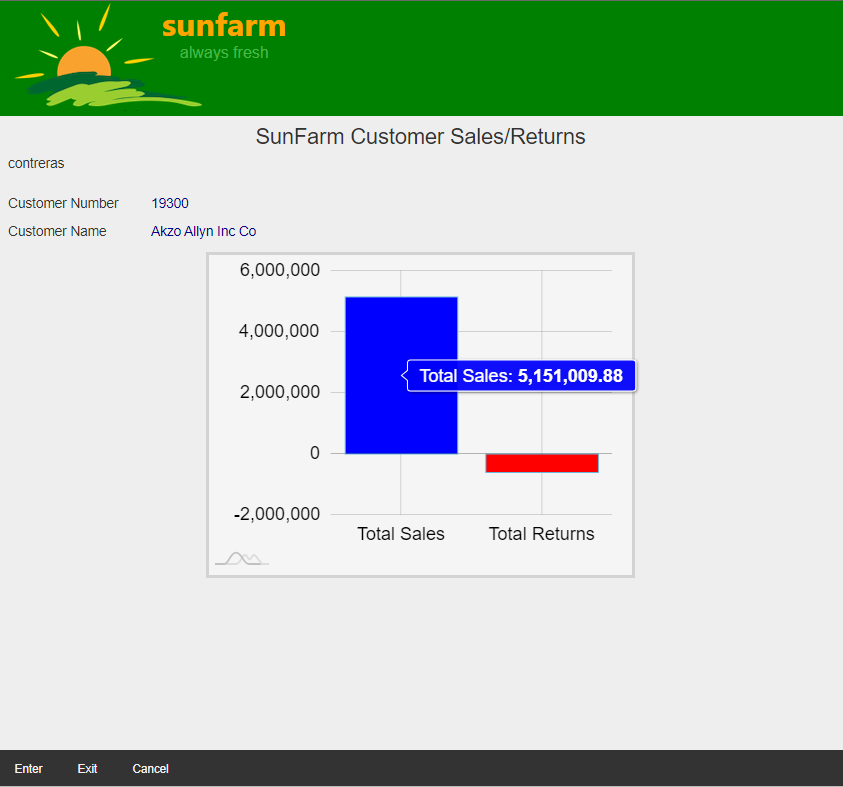 |
Note: Hovering on the columns shows the numeric Sales or Returns value.
Eliminating scrollbar that may appear when using standard HTML elements
Although we successfully achieved our goal to add a nice Chart by the technique introduced so far, we still have a minor challenge to solve.
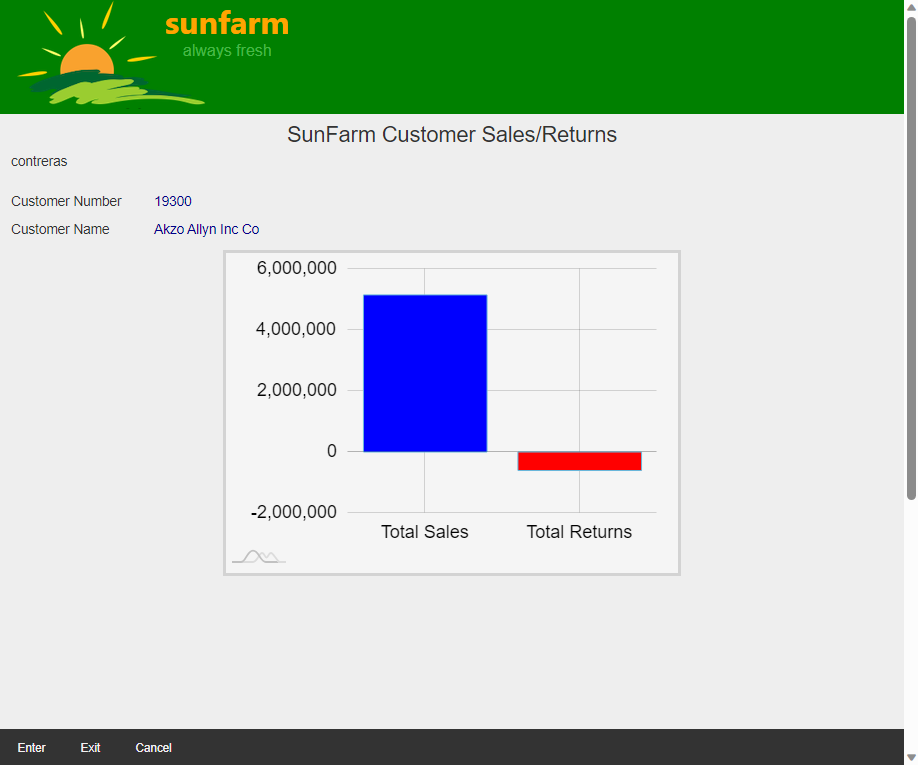
Look closely at these two renderings of the Sales/Returns page.
| After adding Chart, scrollbar appears | Scrollbar eliminated |
|---|---|
 |
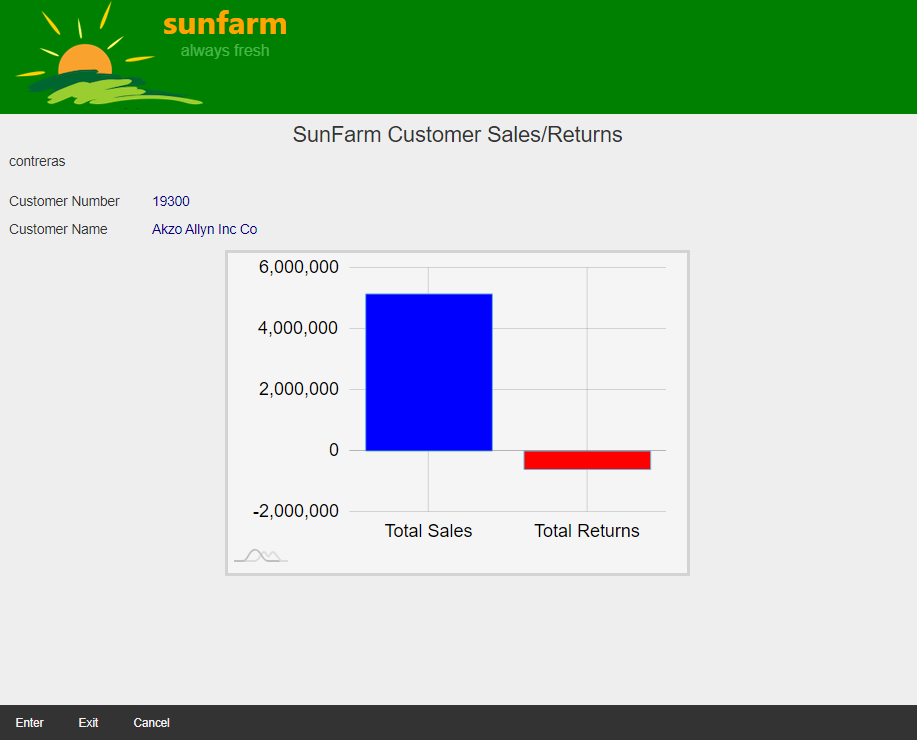 |
The image on the left shows an unexpected vertical scrollbar (the one on the right does not).
When something like this appears, you will find that the best practice is to use Browser Developer Tools to inspect how a page got generated.
Legacy Display files produce a square rendering with fixed number of rows (and character positions - aka columns -). Typical Sizes are 80x24 and 132x27. Web Browser’s canvas does not have such limitation, in fact, it is said that elements Flow down and to the right as they are naturally placed in the DOM. (There are of course many ways to control how elements are positioned, for this discussion we rely on the basics).
The Expo Display Pages uses the Expo Client JavaScript Library to generate elements that mimic - a full - legacy page.
The pseudo HTML code below shows how the legacy height is accomplished on an Expo Display Page:
<div Record="FIRST-ACTIVE-RECORD" >
  <div Row="1" />
  <div Row="2" />
  <div Row="3" />
</div>
<div Record="SECOND-ACTIVE-RECORD" >
  <div Row="4" />
  <div Row="5" />
  <div Row="6" />
</div>
<div Record="THIRD-ACTIVE-RECORD" >
  <div Row="7" />
  <div Row="8" />
  <div Row="9-18" />  <!-- Subfile renders ten rows -->
</div>
<div Record="FOUR-ACTIVE-RECORD" >
  <div Row="19" />
  <div Row="20" />
  <div Row="21" />
  <div Row="22" />
  <div Row="23" />
  <div Row="24" />
</div>
Imagine now that the CSS Style used on each div (for lines using Row attribute) is such that its height is fixed (based on the Font selected). Having exactly 24 of these vertically positioned divs will render a constant height of 24 * height of Row pixels.
In reality, seldom do legacy pages define elements on ALL rows, the definition may more likely be like the following (again using pseudo HTML):
<div Record="FIRST-ACTIVE-RECORD" >
  <div Row="1" />
</div>
<div Record="SECOND-ACTIVE-RECORD" >
  <div Row="4" />
  <div Row="5" />
  <div Row="6" />
</div>
<div Record="THIRD-ACTIVE-RECORD" >
  <div Row="7" />
  <div Row="9-18" />  <!-- Subfile renders ten rows -->
</div>
<div Record="FOUR-ACTIVE-RECORD" >
  <div Row="23" />
  <div Row="24" />
</div>
Note how Rows 2, 3, 8, 19, 20, 21 and 22 are missing. It is assumed that when rendering Row=4, the missing rows: 2 and 3 need to be added to fill the gap. Same happens for the remaining row gaps, as illustrated below:
<div Record="FIRST-ACTIVE-RECORD" >
  <div Row="1" />
  <div Empty-Row="2" />
  <div Empty-Row="3" />
</div>
<div Record="SECOND-ACTIVE-RECORD" >
  <div Row="4" />
  <div Row="5" />
  <div Row="6" />
</div>
<div Record="THIRD-ACTIVE-RECORD" >
  <div Row="7" />
  <div Empty-Row="8" />
  <div Row="9-18" />  <!-- Subfile renders ten rows -->
</div>
<div Record="FOUR-ACTIVE-RECORD" >
  <div Empty-Row="19" />
  <div Empty-Row="20" />
  <div Empty-Row="21" />
  <div Empty-Row="22" />
  <div Row="23" />
  <div Row="24" />
</div>
Note: Empty-row attributed
divshave been added to fill gaps. This is done automatically by Expo Client JavaScript Library
Empty-row attributed divs use a CSS Style with a Empty (or blank) content with a height equal to the normal Row-attributed divs.
If we compute the total Page height: 17 * Row-height + 7 * Empty-Row-height pixels, matching the height we desire (same as 24 * height of Row pixels).
For more on how how Expo Display files are rendered, read here.
What happens now if we suddenly added an element to the page, in the middle of our square geometry?
Consider:
<div id="sales-chart-container">
    <div id="sales-chart">Sales Chart</div>
</div>
The height of div id="sales-chart-container" will make our Page taller . With the Browser window height we had adjusted to a normal Display page, a vertical-scrollbar will appear.
We can use the Browser Developer Tools to inspect how a page got generated. Looking at the elements rendered, we identify that The Empty Rows from 6 to 20 should be eliminated. (We could optionally use absolute positioned Chart, but this presents other challenges).
Using the property ExcludeEmptyRows
we can eliminate Selected Empty-Row divs.
ExcludeEmptyRows property takes a comma-separated list of either numeric ranges, or single values describing the EmptyRow we DO NOT want to inject to complete the (otherwise) constant vertical height.
<DdsRecord For="SALESREC" StretchConstantText=false KeyNames="F12 'Cancel';"
           ExcludeEmptyRows="6-20">
| Excluding some Empty Rows with Inspector Open |
|---|
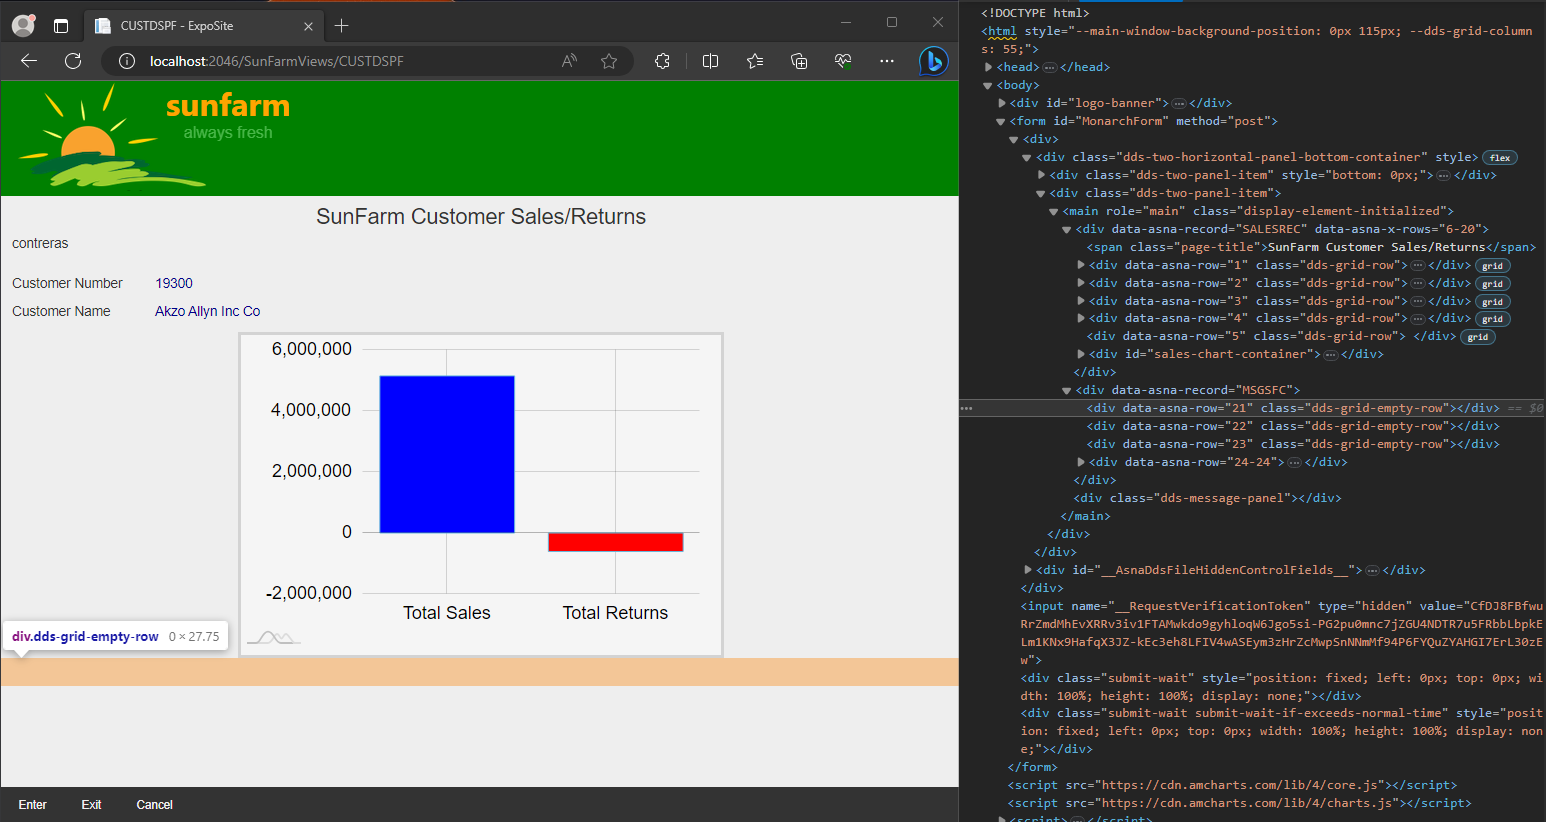 |
Without the unnecessary Empty-row attributed divs the vertical scroll-bar is gone!
The image above shows the Developer Tools Inspector open to observe the new HTML, where the empty-rows from 6 to 20 have been eliminated. The Page height is back to its normal 24 rows.